“Stickiness” in cotton is a major problem that affects throughput in cotton gins and spinning mills alike. Sticky cotton can result in damage to the gin, including flash fires, and can cause spun yarn to separate or a failure of dyes to adhere to spun fabric. Stickiness is thought to be caused by the deposition of sugars, that is, metabolic by‐products, by insects, principally aphid and white fly, on the open boll. Stickiness is not uniform, instead the metabolic by-products are discrete, widely displaced, deposits, and the deposits are typically on the order of only 2mm in diameter. Fourier Transform Near Infrared (FT‐NIR) Spectroscopy was used to develop models for sugar content from High Pressure Liquid Chromatography (HPLC) data, Thermo-detector and Mini-Card data (a subjective physical measurement). The FT‐NIR spectrometer was used because the usual 10 nm bandpass of dispersive instruments could not resolve the spectral features of the sticky deposits. A higher resolution spectrometer was required. A total of 457 cotton samples was selected to represent both Upland and Pima varieties, and cotton processing before and after ginning. A successful chemometric model was generated to determine the Mini-Card value and successfully detect “stickiness". The Standard Error of Cross Validation (SECv) was 0.26 “mini-card” units with an R2 of 0.96. The model was not improved by increasing the range of “stickiness” as measured by the “mini-card” from the usual 0‐3 scale to a scale of 0‐8. If a value is determined to be greater than 1 it is difficult to blend bales at a spinning plant "opening line" to allow for maximum efficiency of spinning. These models worked well for laboratory based FT-NIR spectrometric systems.
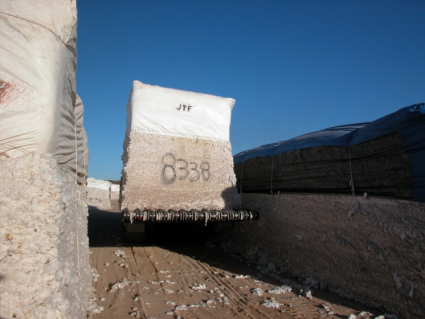
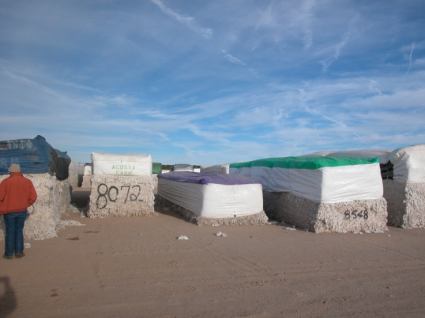
An instrument to take to the gin yard and gin was required to be able to measure the stickiness in situ. LLS Instruments ReSpect4π spectrometer has an integrated sampling area of 30cm in diameter. The spectrometer was successful in making the measurements in the field on the cotton modules, which are 2.5m × 2.5m × 12m (8ft × 8ft × 40ft) 10,000kg (22,000 pound) blocks of raw cotton. As can be seen in the accompanying photographs a cotton module is not the "usual" sample. Figure 1 is a photograph of cotton modules in the gin yard. Modules are transported to the gin by module trucks, Figure 2. Once the module is loaded at the gin intake it takes 20 minutes to open the module to separate the cotton as it is fed into the gin. As the module is being opened the ReSpect4π spectrometer can scan the side of the module, a 2.5m × 12m surface, as shown in Figure 3. The instrument was able to detect stickiness in cotton modules during the opening at the gin down to a level of 750 ppm. Since the module is filled in layers from bottom to top, the side is representative of how the module is constructed and is representative of the whole.

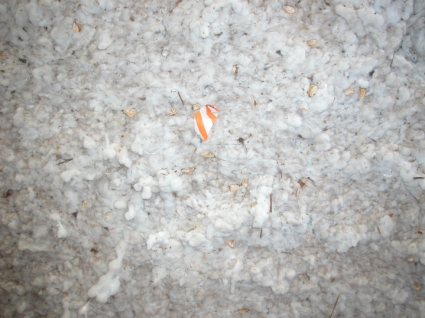
The question is often asked if some of the new higher resolution handheld instruments could make the measurement. The answer is yes, if they can find the sticky spots (Figure 4). To measure the side of the module with one of the handheld instruments as thoroughly as the ReSpect4π, it would take several years, nonstop, no sleeping, eating or rest. The large sampling area of the ReSpect4π makes the assay possible.